

Computer-Use Agents Need Screen-Level Audit Logs
By wGrow Project Team ·
The agent clicked Delete instead of Archive. The event log records a successful tool call. The user’s record is gone. The compliance officer opens the audit trail, finds a timestamp and a JSON payload, and has nothing useful to show a dispute panel.
That is the architectural gap. An API log records what the agent requested. A basic tool log records the command dispatched. Unless the harness is explicitly configured to capture DOM state, pixel frames, and action coordinates at each step, neither will show what the interface actually rendered when the click landed — or whether the target element was even at that coordinate.
The Timestamped Theatre of API Logs
Command logs work when agents operate clean, deterministic APIs. The request is the action; the response is the outcome. There is no rendering layer between them — so there is nothing to miss.
Browser and desktop automation is different. A graphical interface introduces rendering latency, layout shifts, overlapping modals, and asynchronous DOM mutations. The agent issues a pointer event at a coordinate. The system responds. The log records success. But a successful tool call doesn’t prove the correct element was at that coordinate when the click landed.
The audit trail, in that case, is theatre. It proves the agent dispatched a request and the harness recorded a success. It does not prove the intended control was under the pointer when the click landed, or that the user-visible state matched the business outcome the log claims. In a compliance context, that gap is the entire case.
Legacy Lessons from a 2014 Procurement System

We built a government procurement workflow in 2014. Users disputed system-generated approvals from the first week — genuine disputes, not bad-faith ones. The database transaction logs were technically accurate. Users insisted the interface had shown them different data at the moment they submitted. We couldn’t disprove that. The logs recorded what the database wrote, not what the form rendered.
The fix wasn’t more logging at the API layer. We engineered visual state snapshots tied to every form submission: a serialised DOM tree, a screenshot, and a coordinate map of the submit action. Disputes that had stalled on competing recollections moved quickly once reviewers could compare what the database wrote against what the form had actually rendered at submission time. The conversation shifted from memory to a specific screen state.
The psychology of disputes against automated systems hasn’t changed. Only the automation has. If a user today challenges what an autonomous agent did inside a legacy CRM or government portal, a JSON payload from the tool layer is not a sufficient receipt. The visual receipt is.
Debugging Agent Misreads with Screenshot Diffs
| 1 | { | |
| 2 | "timestamp": "1698054000", | |
| 3 | "tool": "browser_pointer", | |
| 4 | "action": "click", | |
| 5 | "target_x": 450, | |
| 6 | "target_y": 320, | ← ① |
| 7 | "status": "success" | |
| 8 | } | |
| 9 |
- ① API reports success, but a rendering delay or modal popup may have blocked the target.
We run browser automation agents internally for QA across client environments. A recurring failure mode: the agent misreads the page structure after a layout shift and clicks the wrong DOM element. Sometimes that action is reversible. Often it is not.
The standard headless trace shows a successful pointer event. Engineering knows the agent clicked something. What they don’t know is what the page looked like at that moment — whether a modal had overlaid the target, whether a dynamic element had shifted position during load, or whether the agent’s internal model of the layout was already stale before the click fired.
Screenshot diffs narrow that ambiguity quickly. The visual delta between expected and actual page state shows whether the agent was working with stale layout, an obscured target, or an element that had shifted before the click fired. Without it, you’re debugging from inference. With it, the failure becomes a concrete regression case rather than a guess.
Engineering the Evidence Layer
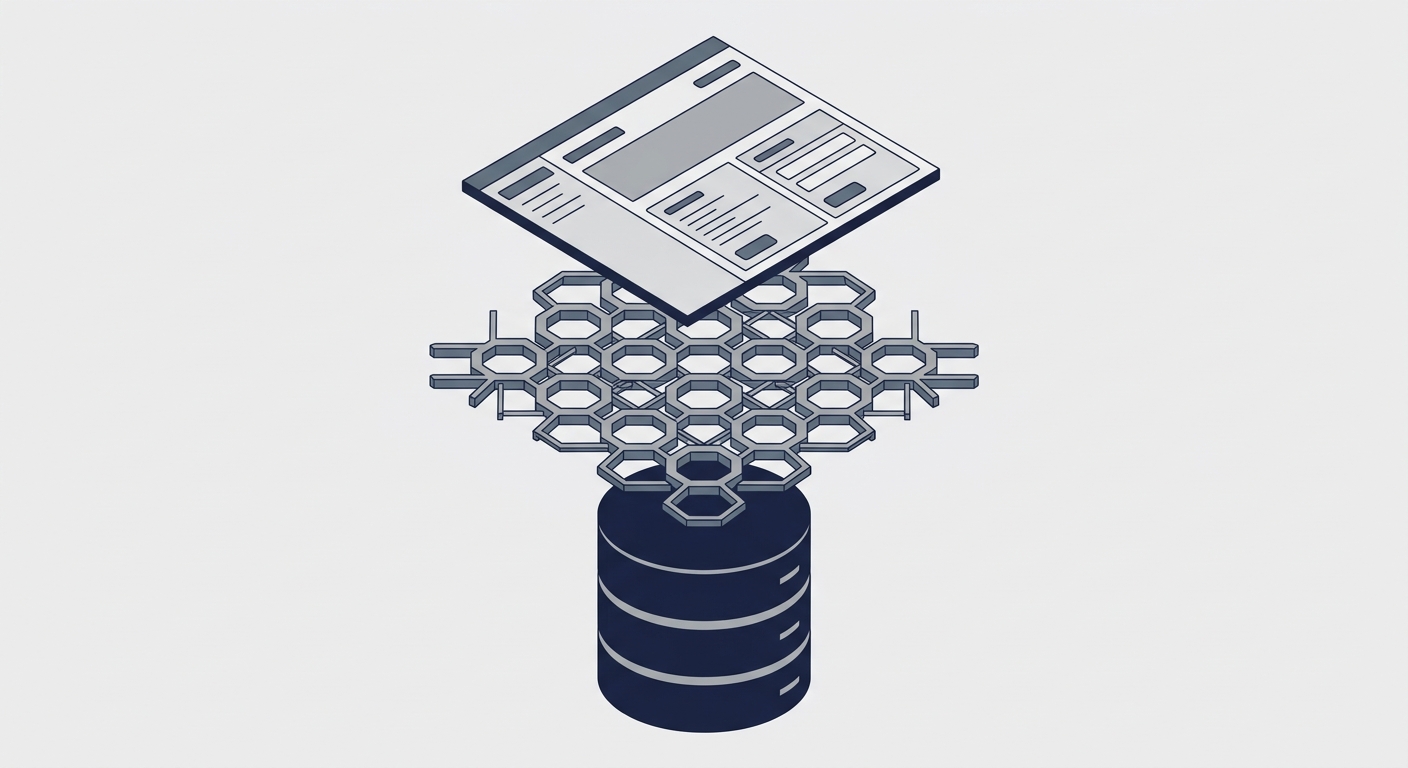
These requirements aren’t complicated. They do need to be enforced architecturally — not left to individual agent implementations, where they will be skipped.
Mandate DOM state capture. If the agent operates in a browser or an Electron application, serialise the DOM tree at the exact moment of each action. A flat text snapshot with a timestamp narrows disputes about page copy, but it cannot establish what was actually visible — the DOM includes hidden elements, and text order in the tree may not match the rendered reading order. For rendered-visibility questions, capture the accessibility tree, which carries visibility state, alongside a coordinate-mapped screenshot.
Mandate coordinate-mapped screenshots. For legacy desktop applications without a readable DOM, capture screen pixels and overlay the exact coordinate of the simulated hardware input. The overlay makes the evidence legible to a non-technical dispute panel.
Require a replayable action trail. Frame-by-frame replay from the error state backward. An auditor must be able to step through the sequence without engineering support.
Redact at capture. Screen capture grabs sensitive data: form fields, names, account numbers. Redaction must happen at the capture layer, before any frame enters the logging pipeline. In regulated environments, this is not optional.
The storage and performance costs of frame-level capture are real. For high-frequency agents, selective capture — triggered on state-changing actions rather than every pointer event — is a practical trade-off that preserves audit coverage where it matters most.
Visual State as Primary Audit Data
Enterprise agents already operate standard desktop UIs: legacy procurement systems, browser-based SaaS tools, Electron wrappers around decade-old backends. That is the current deployment reality, not a future scenario someone is planning toward.
Defer screen-level logging until after production, and compliance and debugging costs will compound with every new capability the agent acquires. Each additional application it can touch adds another surface where tool logs without visual context are insufficient. The problem doesn’t plateau.
Build the visual audit trail before the first compliance audit fails. System logs defend the machine. Visual logs defend the business.